
This blog post, provided by the IPR Behavioral Insights Research Center and written by Dr. Terry Flynn and Tim Li, is based on a research paper by Yasmina Okan, Ph.D., Rocio Garcia-Retamero, Ph.D., Edward T. Cokely, Ph.D., and Antonio Maldonado, Ph.D.
Key Findings
- For bar graphs presenting means, values inside the bar are often incorrectly believed as more likely than an equidistant value outside the bar. This bias is called the “within-the-bar” bias and results from how we perceive shapes and distances.
- The “within-the-bar” bias can influence decision-making, resulting in poorer judgments and decisions.
- Dot graphs do not lead to the “within-the-bar” bias and may be more appropriate for presenting means in graph form.
Implications for Public Relations

Graphs are a valuable way to add visual appeal and communicate complicated information. However, the interpretation of graphs can be biased by how our brains perceive and process shapes and objects. Bar graphs that convey means or averages can lead to the “within-the-bar” bias, where values inside the bar incorrectly appear more likely that those outside the bar. This bias is especially problematic when if the graph is a key source of information for making important decisions, like those around health. Public relations professionals should avoid using bar graphs for presenting means if the graphs are used for making estimates and use dot graphs instead.
Summary
Graphs are an effective way to present data to audiences in a more engaging and accessible manner. The correct interpretation of information presented is essential for well-informed decision-making. However, research has demonstrated that the people’s processing of graphs can be biased by the design, resulting in poorer judgement and decisions.
One common bias is the “within-the-bar bias”, which occurs when people view bar graphs presenting averages and incorrectly believe that the values within the bar is more likely than those outside of the bar. In reality, values on both sides of the top of the bar are equally likely. For example, the below graph shows the average percentage change in blood glucose levels over a week at 0%. Although the likelihood of a 5% increase or a 5% decrease sometime during that week is the same based on the given information, people often view a 5% decrease, which falls inside of the bar, as more likely due to the “within-the-bar” bias.
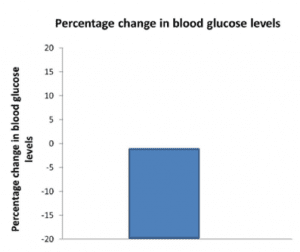
From: Okan et al., 2018
Okan and colleagues examined how this bias can impact health decisions by presenting various graphs including the one above. In two studies, participants were randomly assigned to see the above graph with or without error bars, a version where the x-axis was at the top of the graph and the bar descended from it with or without error bars, or a table of the same data. In this hypothetical situation, they were told that their blood glucose level was ideal at the start of the week and asked to decide whether to decrease or increase glucose based on the information in the graph.
Those that saw the above graph were more likely to choose to increase blood glucose level, whereas those that saw the version with the bar descending from the top of the graph were more likely to choose to decrease levels. Either increasing or decreasing levels in this situation would not be ideal because the average change was 0% and the level was already ideal at the start. Participants mistakenly viewed the values within the bar as more likely, even though equidistant points on both side of the top of the bar, the actual average, are equally likely.
In a third study, the authors tested whether a dot graph could reduce this bias. They present participants with a bar graph, dot graph, or table about added sugar consumption by age group and sex. The participants were asked to estimate the likelihood that group consumed a particular amount of added sugar. The results showed that estimates made using the bar graph were biased towards values within the bar. Estimates made using the dot graph were similar to those made using the table and not biased.
The findings of this study demonstrate how people can be biased by the way information is presented in graph form, resulting in poorer judgments and decision-making. Presenting means in bar graph format may not be ideal because of the within-the-bar bias, which is driven by how we perceive bars as enclosed objects and visually chunk information accordingly. Although the dot graphs were rated as less appealing, they still received positive evaluations, suggesting users will still accept them. Dot graphs may be more appropriate for presenting means data.
Blog post compiled by Terry Flynn, Ph.D. and Tim Li.
Citation
Okan, Yasmina, Garcia-Retamero, Rocio, Cokely, Edward T., & Maldonado, Antonio. (2018). Biasing and debiasing health decisions with bar graphs: Costs and benefits of graph literacy. Quarterly Journal of Experimental Psychology, 71(12), 2506-2519. https://doi.org/10.1177/1747021817744546